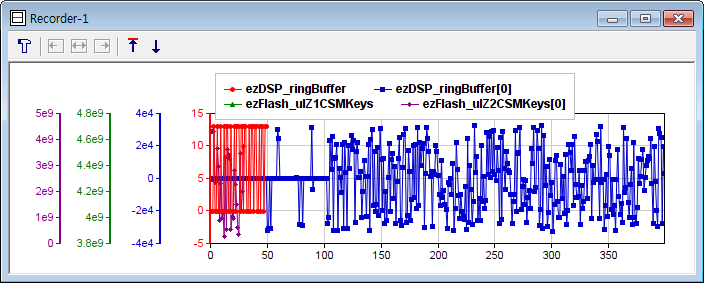

It displays the
data of record file (extension = rec) which was saved before in either Chart
window or Plot window.
Thus, your first action is opening the record file by clicking
 button.
When opening it, all
settings you made before was automatically restored i.e. record file, zoom
in/out area and various display mode.
Toolbar
: When clicked, the below dialog box shows up with the information of record file name and its saving time. The other part is same to that of either Chart or Plot window.
'Channel' : It just display the variable name and its data count as the record file has. No change is possible.
'Scale' : Select the Y-axis range. 'Auto' will adjust its scale automatically based on the variable values in every display.
'Display' : Determines its display mode.The colors and symbols are predefined as follows.
channel #1 : red - circle
channel #2 : blue - square
channel #3 : green - triangle
channel #4 : violet - diamond
channel #5 : black - right triangle
channel #6 : weak green - left triangle
channel #7 : grey - '+' shape
channel #8 : orange - 'x' shape
: shows the left-most part of graph.
: shows all graph data.
: shows the right-most part of graph.
: load the record file. This is your first action to use this window.
: saves the current graph into graphic file (bmp, jpg, png formats) or save the current graph data into text file (csv format).
Useful features
- Please check the link how to use the graph